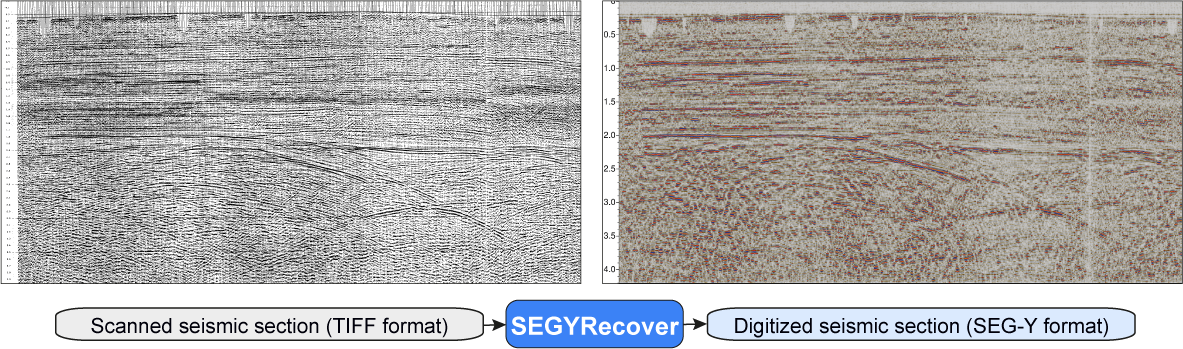
A Python tool for digitizing scanned seismic sections and converting them to standard SEG-Y format.
Go to Installation to see how to install SEGYRecover.
Quick Start Guide
Key Features
- Digitization of seismic images - Convert paper/raster seismic sections into SEG-Y files
- User-friendly GUI - Simple step-by-step workflow with visual guidance
- Timeline removal - Isolates and remove horizontal timelines
- Automatic detection - Identifies individual trace baselines for accurate digitization
- Frequency Filter - Apply bandpass filtering to remove noise and enhance signal quality
Basic Workflow
- Load an image: Select a seismic image file to digitize
- Set parameters: Configure trace-time mapping and processing settings
- Select ROI: Mark the region of interest on the image
- Process: Run digitization and review results
- Save: Output a standard SEG-Y file ready for interpretation
First Run Setup
When you run SEGYRecover for the first time, you'll need to set up your data directory:
- The First Run Dialog will appear asking you to select a location for your data
- Choose a location with plenty of disk space - this is where all your images, parameters, and output files will be stored
- Click "OK" to confirm your selection
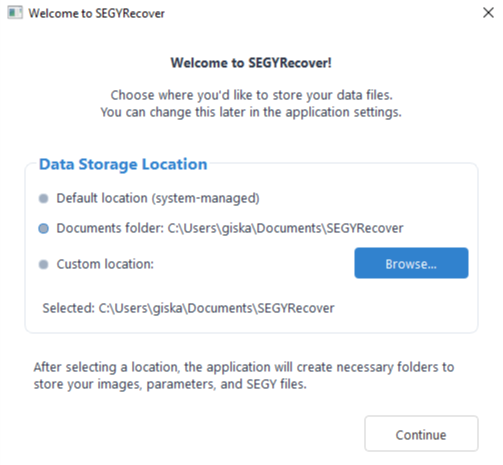
First Run Setup Dialog
Note: The application will automatically create example files in your data directory to help you get started.
Preparation
Before beginning the digitization process, it's important to organize your files and understand the requirements:
1. Organize your files
- Place all seismic image files you want to digitize in the
IMAGESfolder - If you have coordinate information, create corresponding geometry files in the
GEOMETRYfolder - Ensure geometry files have the same base name as the image files with a
.geometryextension - You can access and manage your data directory at any time through the File menu:
- File → Open Data Directory: Opens your current data folder in File Explorer
- File → Set Data Directory: Changes the location of your data folder
2. Check supported formats
- Image files: TIF, JPG, PNG. Images should be binary, only black or white pixels
- Geometry files: Text files with CDP, X, Y coordinates:
CDP_NUMBER X_COORDINATE Y_COORDINATE
100 500000.0 4500000.0
101 500025.0 4500020.0
102 500050.0 4500040.0
3. Verify image quality
- Seismic sections should be plotted in variable area / wiggle, with positive amplitude filled in black
- Higher resolution images generally yield better results
- Minimal annotations overlapping the seismic section is preferable
Step 1: Loading an Image
- From the Welcome screen, click the "Start New Line" button
- Click the "Load Image" button to select your seismic section file
- Navigate to your image and click "Open"
- The image will be loaded and displayed in the preview area along with the coordinates file
- Once the image is loaded, click "Next" to proceed to the Parameters tab
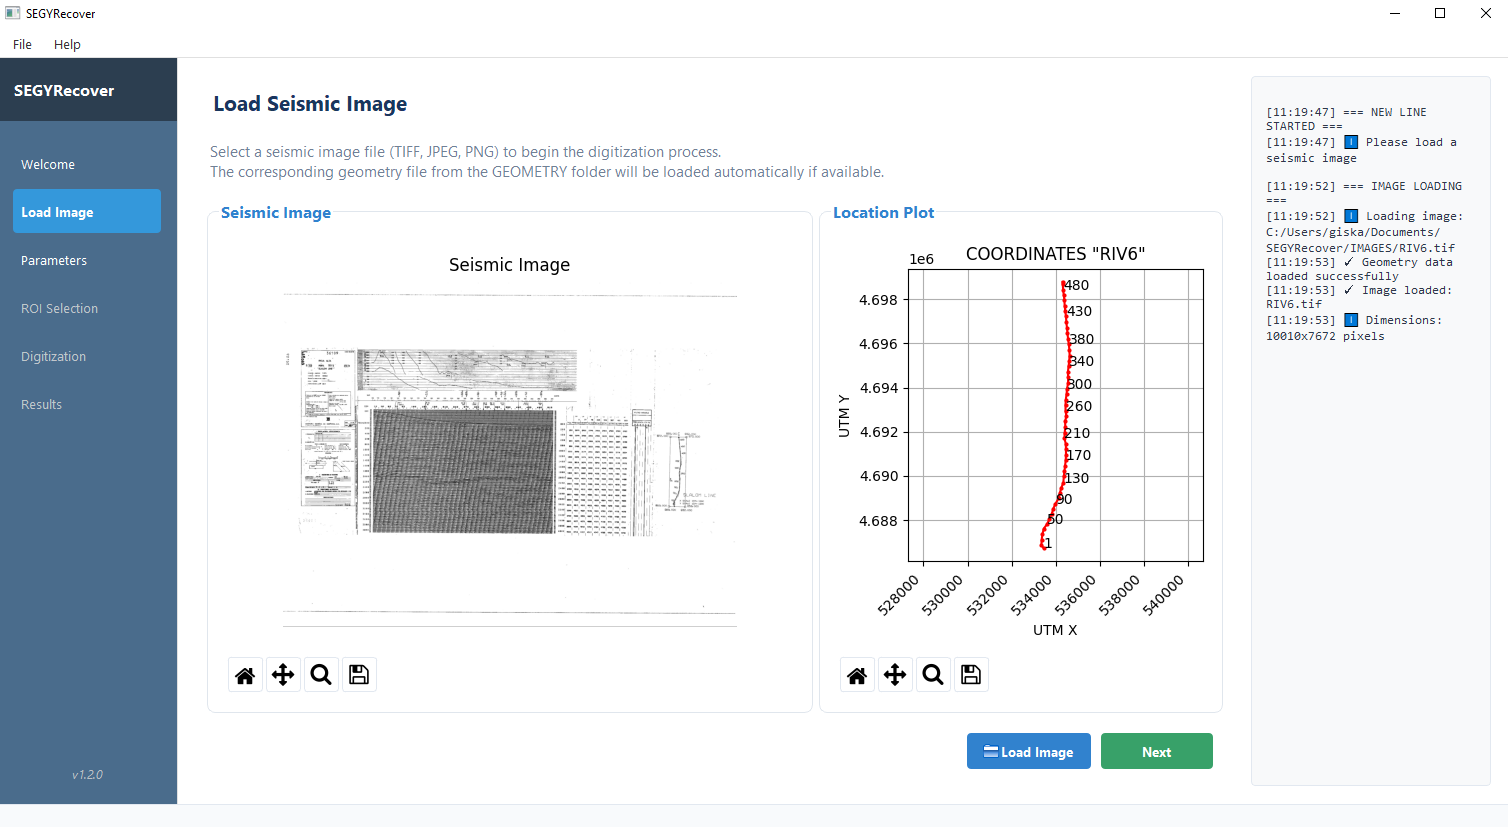
Window for loading the seismic section image
Step 2: Setting Parameters
In this step, you'll configure how the software interprets your seismic image by defining trace and time coordinates, and setting processing parameters.
- After loading your image, you'll be automatically taken to the Parameters tab
- If parameters were previously saved for this image, they will be loaded automatically
- Fill in the parameters in each section as described below
- Click "Save Parameters" to store your settings
- Click "Next" to proceed to the ROI Selection tab
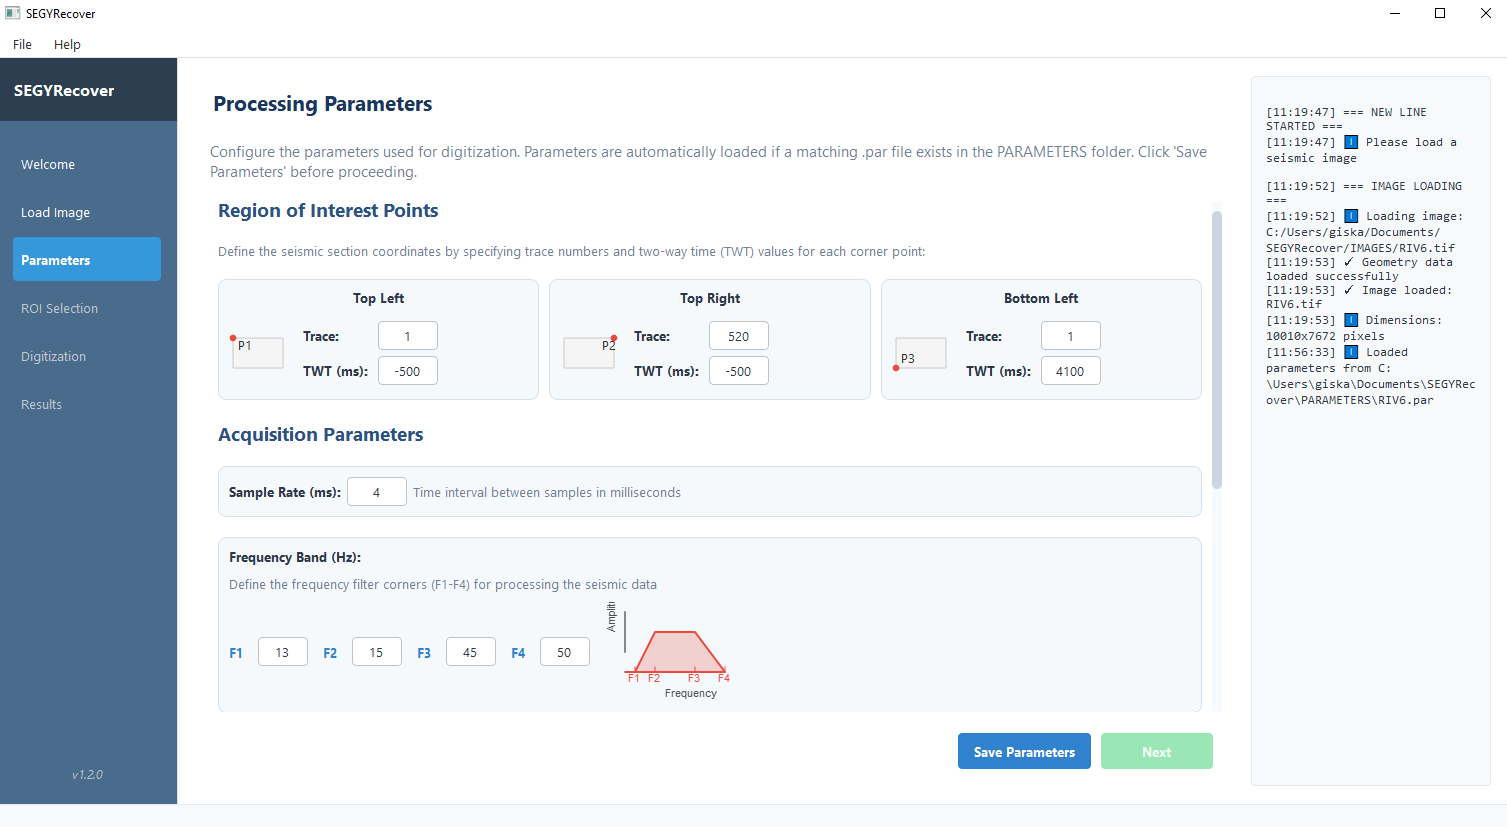
Window for entering processing parameters
Region of Interest Corner Points
These define the region occupied by the seismic section and maps the image pixels to the seismic trace/time coordinates:
- P1 (Top Left): Set Trace number and TWT (Two-Way Time) value
- P2 (Top Right): Set Trace number and TWT value
- P3 (Bottom Left): Set Trace number and TWT value
- Top left corner (P1): Trace 100 at 0 ms
- Top right corner (P2): Trace 500 at 0 ms
- Bottom left corner (P3): Trace 100 at 3000 ms
Acquisition Parameters
- Sample Rate (ms): Time between data points (common values: 2 or 4 ms)
- Frequency Band (Hz): Four values that define the bandpass filter:
- F1: Start cutting off below this frequency
- F2: Keep everything above this frequency
- F3: Keep everything below this frequency
- F4: Start cutting off above this frequency
Common values:
- For vintage seismic data: F1=8, F2=12, F3=60, F4=80
- For modern data: F1=3, F2=5, F3=80, F4=100
Detection Parameters
- TLT (Traceline Thickness): Width of vertical trace lines in pixels. Usually 1 pixel (increase for thick traces).
- HLT (Timeline Thickness): Height of horizontal time lines in pixels. Usually 4-8 pixels.
Advanced Parameters
For most images, you can leave these at default values.
- HE (Horizontal Erode): Controls how aggressively horizontal features are removed. Increase if timelines are not properly isolated. Usually 100 px or more.
- BDB (Baseline Detection Beginning): Starting row for trace detection, measured from the top edge in pixels.
- BDE (Baseline Detection End): Ending row for trace detection, measured from top.
- BFT (Baseline Filter Threshold): Controls how strictly the software filters out duplicate traces (percentage, 0-100). Default value 80%.
Step 3: Selecting Region of Interest
In this step, you'll mark three corners of your seismic image to define the area to be digitized. The software will correct for any skew or distortion in the image.
- After setting parameters, you'll be automatically taken to the ROI Selection tab
- Your image will be displayed with a prompt to select three corner points
- Use the magnifier button to zoom into the top-left corner of the seismic section
- Click the "Top-left (1) button", then click on the desired point of your seismic section
- Use the Home button to return to the full seismic section view
- Use the magnifier button to zoom in the top-right corner, select the (2) button and click in the the desired point location
- Repeat for the bottom-left corner
- The fourth corner will be calculated automatically
- The selected ROI will be used for cropping and rotating the seismic section
- Verify the result and click "Accept"
- Click "Next" to proceed to the Digitization tab
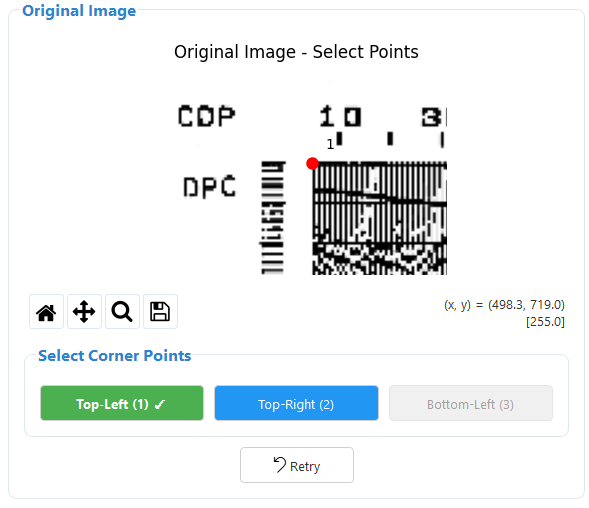
Selection of the top-left point (red)
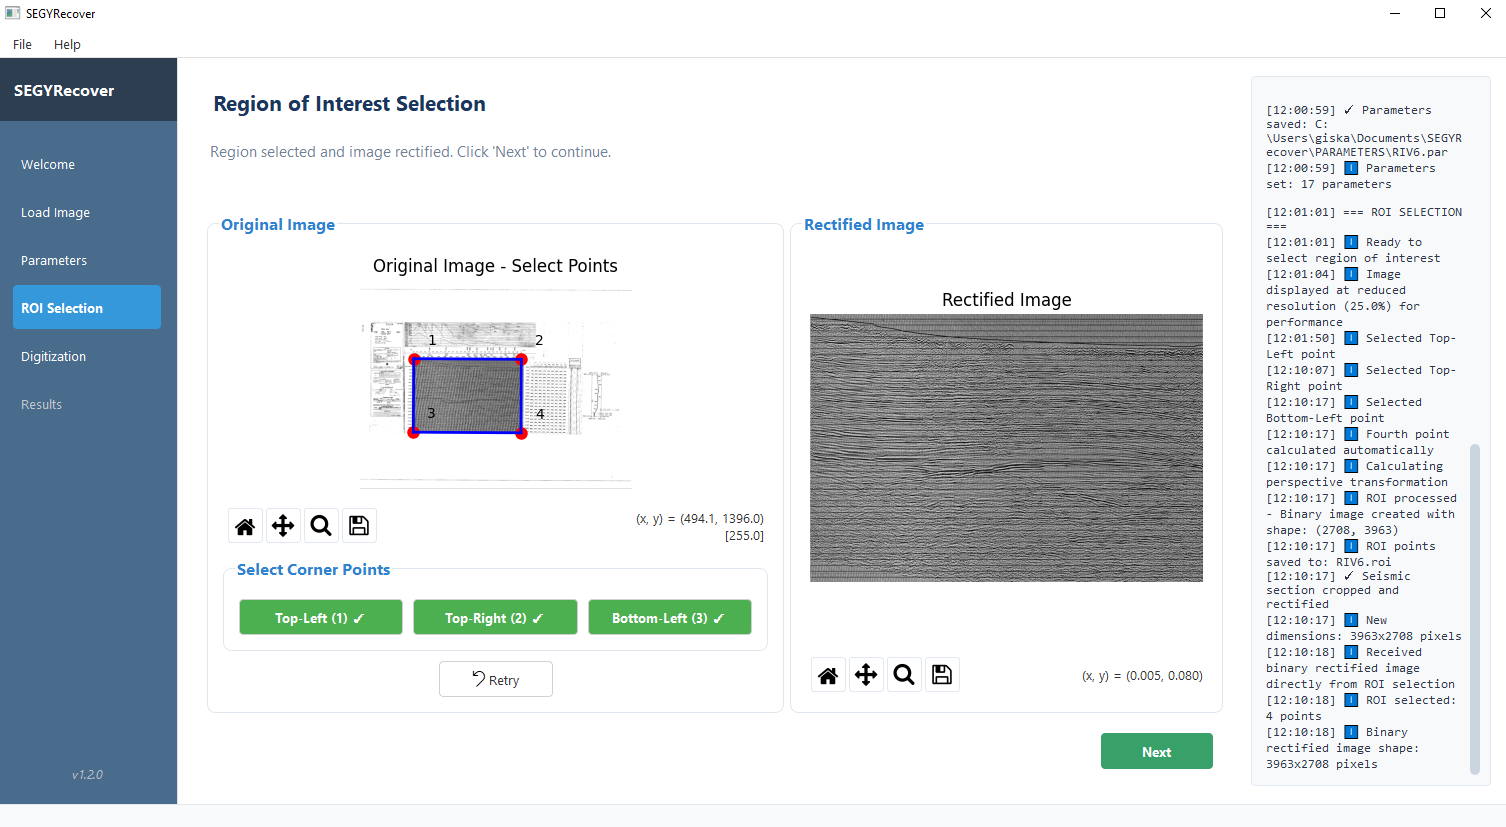
Region of interest selection and image rectification completed
Step 4: Processing
After confirming your ROI selection, you'll be taken to the Digitization tab where you can start the automatic processing of your image.
- Click the "Start Digitization" button to begin processing
- Monitor the console for information on each processing step
- When prompted for coordinate assignment, select the correct CDP direction
- Once processing is complete, you can verify the processing steps in the visualization window
SEGYRecover performs these processing steps automatically:
1. Timeline Detection and Removal
- Isolates horizontal timeline marks
- Removes timelines from the original image
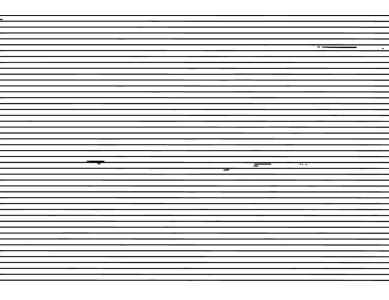
Timelines incorrectly isolates due to a HE parameter too low (HE=200)
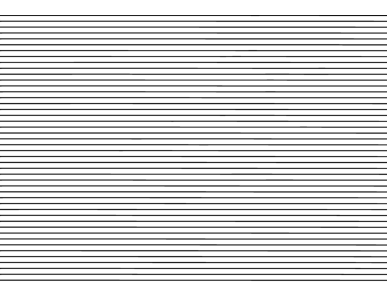
Timelines correctly isolated (HE=600)
3. Baseline Detection
- Identifies vertical trace lines
- Shows a verification window of the seismic section without timelines and with baselines overlay in green
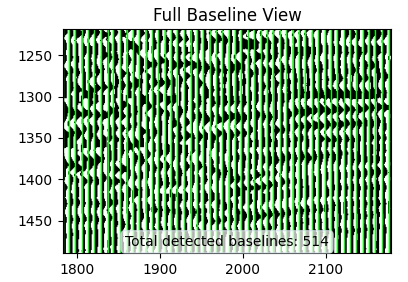
Trace baseline position overlay in green over the seismic section without timelines
4. Amplitude Extraction
- Extracts amplitude values between detected baselines by counting the number of black pixels per row
- Processing methods after raw amplitude extraction:
- Zero-values are assigned a new value equal to -(median) of each trace
- Handles clipped values using Akima interpolation for natural curve restoration
- Smooths the curve with a moving average
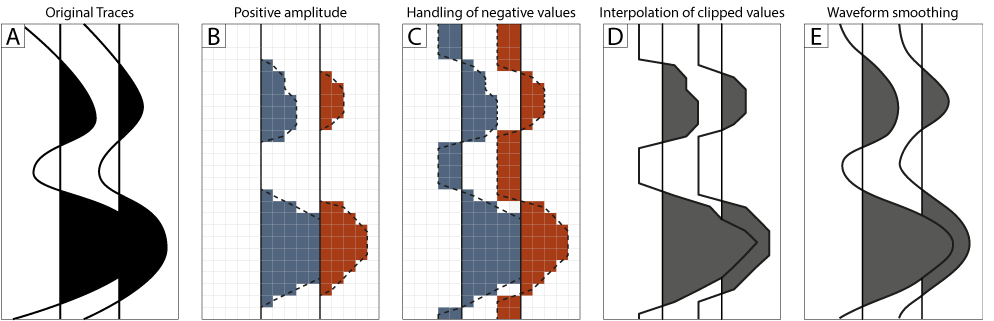
Steps performed for amplitude extraction
5. Data Processing
- Resamples to the specified sample rate
- Applies bandpass filtering using the specified frequency band
6. SEG-Y Creation
- A "Coordinates Assignment" dialog appears to select CDP order (increasing or decreasing from left to right)
- The application interpolates coordinates for all traces
- Creates a standard SEG-Y file with properly populated headers including:
- Sample interval
- Number of traces and samples
- Frequency filter parameters
- Trace coordinates
- The SEG-Y file is automatically saved in the SEG-Y folder
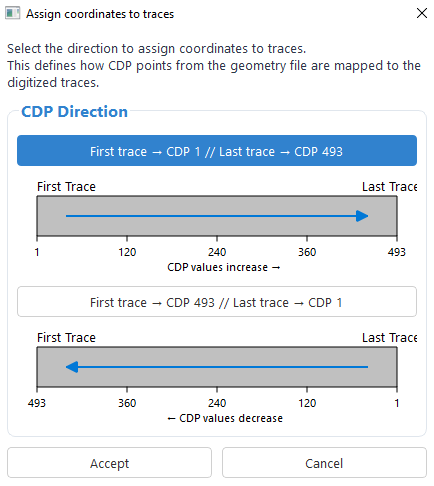
Dialog for assigning the direction of CDP increase
Step 5: Results
When processing is complete, you'll be taken to the Results tab where you can view and analyze your digitized SEG-Y data.
- The digitized SEG-Y section is displayed in the main view
- An amplitude spectrum graph shows the frequency content of the data
- Check the console for a summary of the digitization results
- Click "Start New Line" if you want to process another image
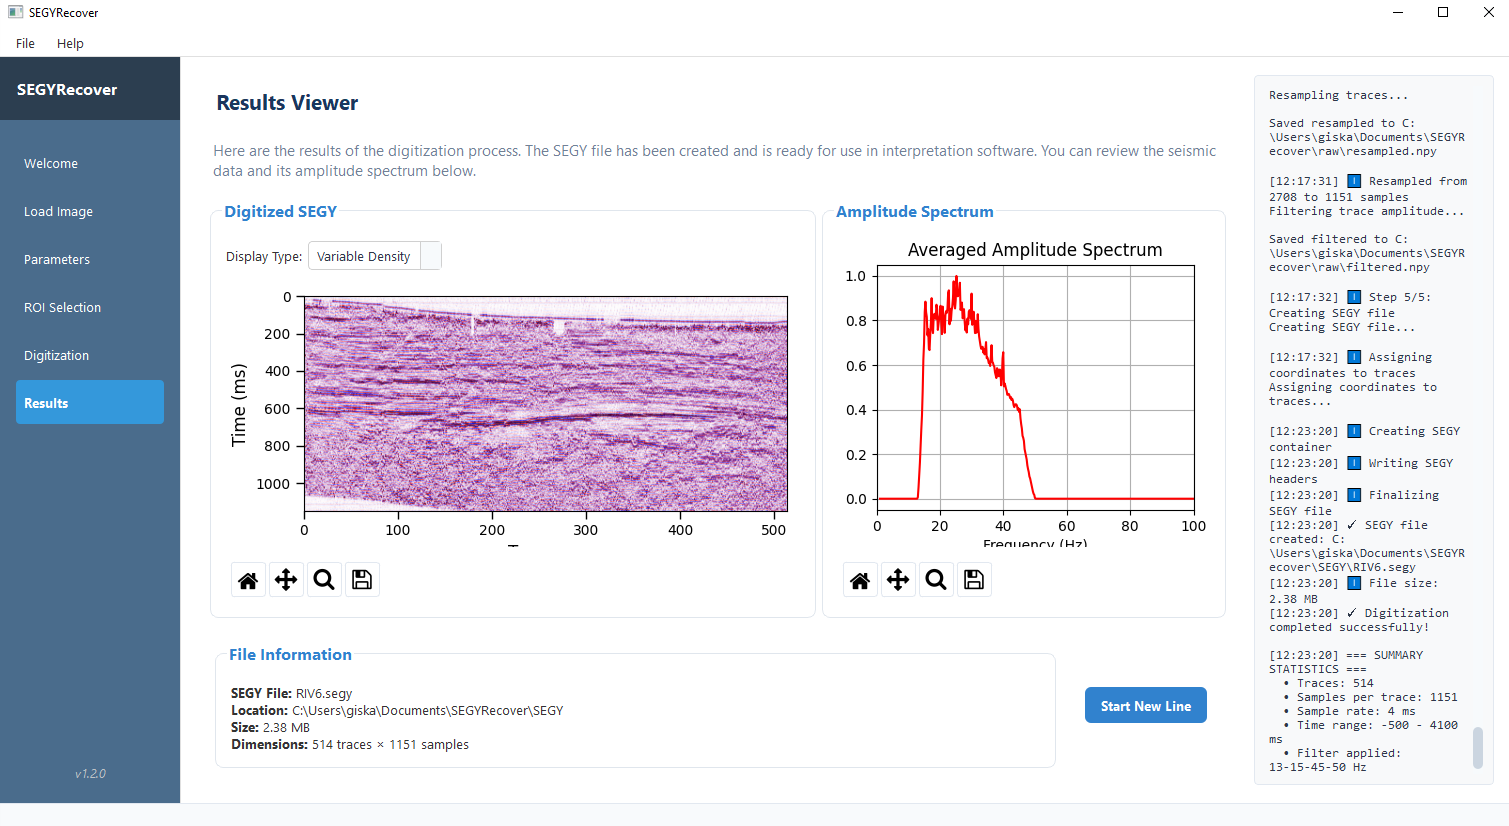
Window displaying the final digitized SEG-Y and its amplitude spectrum
Accessing Your SEG-Y Files
You can easily access your processed SEG-Y files in several ways:
- Click "File → Open Data Directory" from the menu bar, then navigate to the SEG-Y folder
- The file location is shown in the console panel
- SEG-Y files can be directly loaded into interpretation software like OpendTect, Petrel, Leapfrog or Kingdom
Troubleshooting
Use this guide to resolve common issues you might encounter when using SEGYRecover:
Poor timeline detection
- Increase HE (Horizontal Erode) parameter if timelines aren't being fully removed
- Make sure your ROI selection correctly aligns timelines horizontally
Missing or extra baselines
- Adjust TLT (Trace Line Thickness) to match your image's trace width
- Modify BDB and BDE to focus detection on cleaner parts of the image
- Increase BFT to filter out false detections
Noisy or spiky data
- Adjust frequency filter parameters (F1-F4) to better match your data
- Try a narrower frequency band to reduce noise
- Check if your ROI includes non-seismic elements
Coordinate assignment issues
- Verify your geometry file format (CDP, X, Y values)
- Ensure CDP numbers in the geometry file match those in your parameters
- Use a consistent coordinate system (UTM recommended)
Log Files
SEGYRecover creates log files for each session in the LOG folder. These contain process details and error messages that can help diagnose issues.
Frequently Asked Questions
How can I improve the quality of my results?
- Start with the highest resolution scan possible
- Experiment with different frequency filter settings
- Ensure time lines are properly detected and removed
- Make your ROI selection precise
Can I process multiple images in batch mode?
Currently, SEGYRecover processes one image at a time. Process them sequentially using "Start New Line" after each completion. Save parameters for similar images to speed up your workflow.
What if I don't have geometry data?
You can still digitize the image, but the SEG-Y will not have real-world coordinates. You can create a placeholder file with first and last CDP numbers and arbitrary coordinates.
Can I use color seismic images?
SEGYRecover works best with black and white images. Convert color seismic images to grayscale or black/white before processing for optimal results.